Getting started
To demonstrate, we will plot the simple network: (A,((B,#H1),(C,(D)#H1)));
To start plotting, use the packages:
julia> using PhyloNetworks, PhyloPlotsThen read the topology
julia> net = readnewick("(A,((B,#H1),(C,(D)#H1)));")HybridNetwork, Rooted Network
9 edges
9 nodes: 4 tips, 1 hybrid nodes, 4 internal tree nodes.
tip labels: A, B, C, D
(A,((B,#H1),(C,(D)#H1)));
and call plot, as shown below.
plot(net);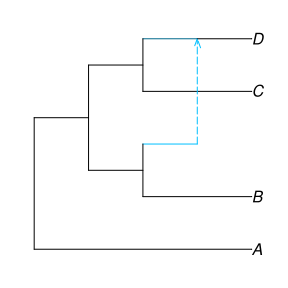
For the function's full documentation, see here: plot.
- By default, v3 uses a
:majortreestyle and:bothhybrid edges curved. Instead, v2 used the:fulltreestyle by default, and had no option to curve edges. - The v0.3 syntax
plot(net, :R; ...)still worked in v1 but was deprecated, and then removed in v2. For example, we could still useplot(net, :R; showNodeNumber=true)in v1, but in v2 (and later) we have to use insteadplot(net; shownodenumber=true). - Compared to v0.3, v1 does not support the Gadfly-based plots, and uses small-case-only argument names.